Post by Admin on Sept 13, 2021 19:16:58 GMT -7
Our sun is average — about half of the known stars are larger, half are smaller. Naturally we have chosen it to be exactly 1 solar mass.
The solar mass (M☉) is equal to approximately 2×1030 kg, about 333000 times the mass of Earth (M⊕), or 1047 times the mass of Jupiter (MJ).
Fusion reactions within a new star require at least 7% of a solar mass to begin.
1. Hydrogen requires the Smallest Stars
2. Helium To begin burning helium a star must have at least 8% solar mass.

Fusion of helium in the core of low mass stars.
3. Carbon
4. Oxygen
5. Neon
6. Magnesium
7. Silicon
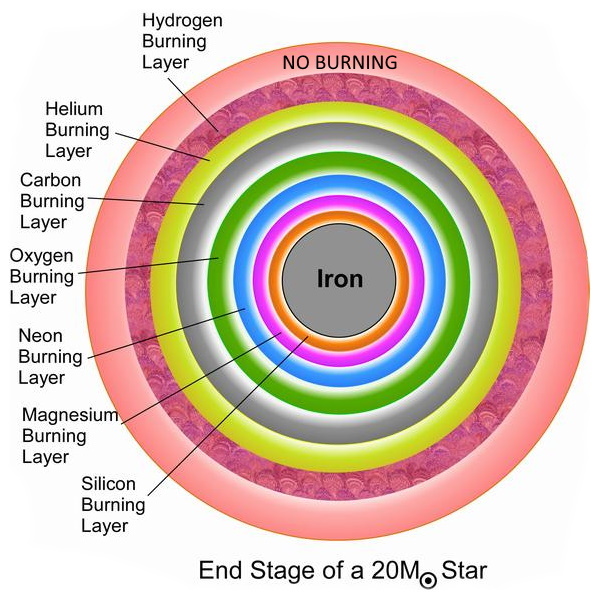
8. Iron
Largest Stars
the most massive star. That honor goes to R136a1, which weighs in at about 300 times the mass of the sun but only about 30 solar radii.
blog.sdss.org/2017/01/09/origin-of-the-elements-in-the-solar-system/
Origin of the Elements in the Solar System
January 9, 2017 / Jennifer Johnson
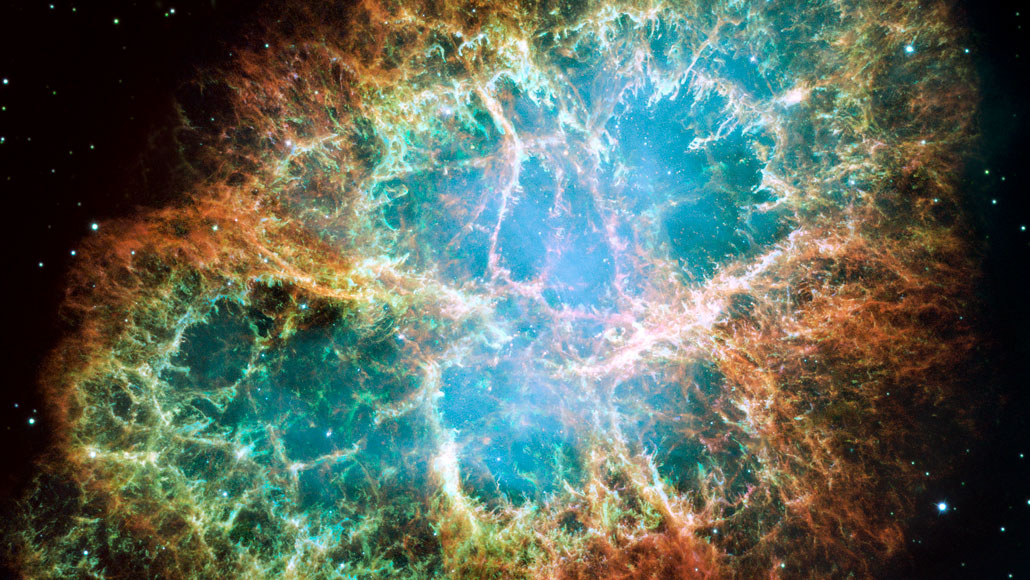
“The nitrogen in our DNA, the calcium in our teeth, the iron in our blood, the carbon in our apple pies were made in the interiors of collapsing stars. We are made of starstuff.” — Carl Sagan
This is an evocative statement. It gets at the heart of the matter. However, it leaves out all the different ways that stars make the elements. It is not just collapsing stars, it is merging stars, burping stars, exploding stars, and the start of the Universe itself.
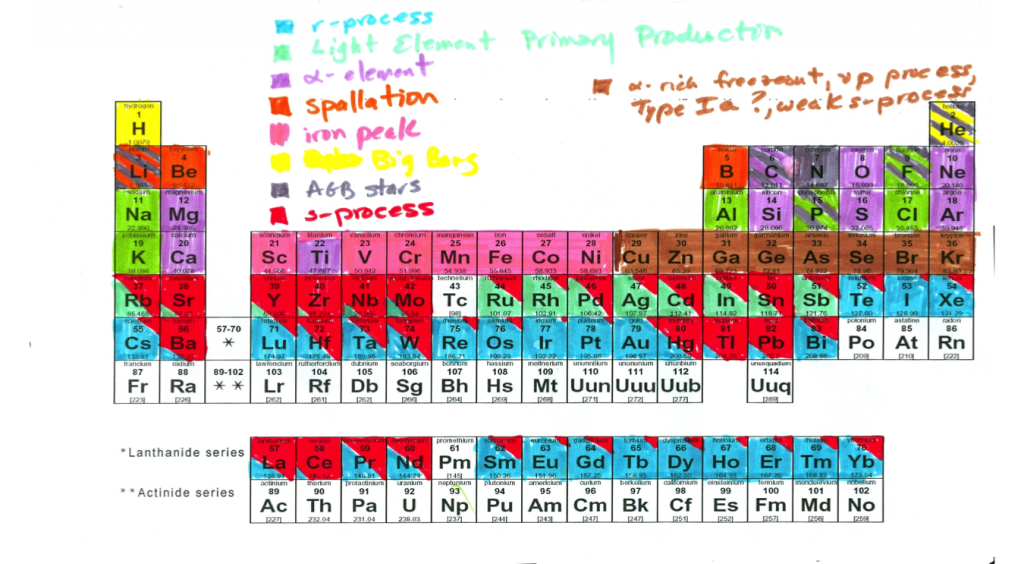
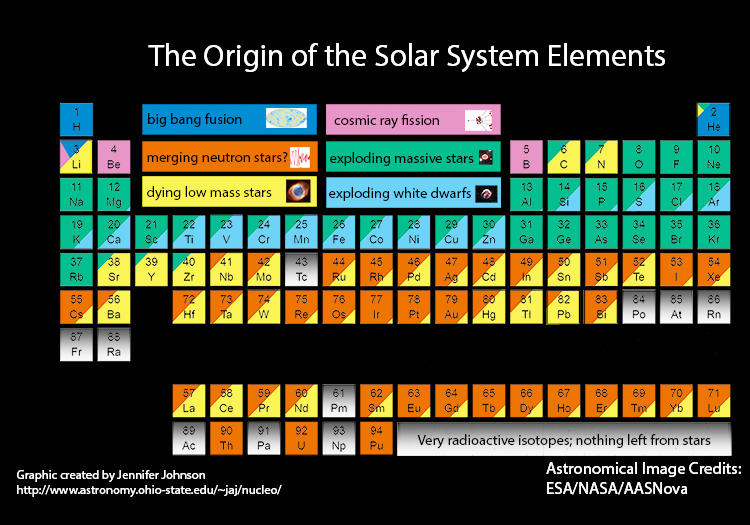
Below is the latest version of an evolving periodic table color-coded by the origin of the elements in the Solar System. An original version of this was made by Inese Ivans and me in 2008 and refined and improved by Anna Frebel. Versions highlighting different aspects of the physical processes are available on Inese Ivans’ website.
My current version of the periodic table, color-coded by the source of the element in the solar system.
My current version of the periodic table, color-coded by the source of the element in the solar system. Elements with more than one source have the approximate amount due to each process indicated by the amount of area. Tc, Pm, and the elements beyond U do not have long-lived or stable isotopes. I have ignored the elements beyond U in this plot, but not including Tc and Pm looked weird, so I have included them in grey.
For this version, I tried to avoid the technical terms and jargon used in the original plot. I also updated the sources of the heavy elements to reflect the current semi-consensus. This graphic draws on an enormous amount of labor from astronomers and physicists. In an upcoming blog post, I will give details on my sources and assumptions for interested parties. Note that this is for the solar system. There will be additional versions showing what this plot would look like if you were in the early Universe, or if you consider the origin of the elements on the Earth, etc.
However, the main point of this blog post is to present the chart and address the following question:
Why does your version have different information than the well-known Wikipedia entry?
The former figure on Wikipedia was based on this plot from Northern Arizona Meteorite Laboratory
Here is a discussion of the some of the differences between the Wikipedia version and mine. In many cases, the Wikipedia graphic is presenting information that is flat-out wrong. I am trying to avoid going into all details in this single blog post. The underlined phrases below represent possible topics for future blog posts where I (or colleagues I coerce bribe ask) can go into more in more detail later, including why we think we are on the right track.
I will assume that “Large Stars” and “Small Stars” are “High-Mass Stars” and “Low-Mass Stars”, respectively. It does not make sense to think of nucleosynthesis origin having to do with the radius of the stars. As this wonderful graphic from NASA’s Chandra website shows, all stars at the end of their lives swell up to red giant and supergiant stars. In its death throes, a low-mass star can have a much larger radius than a normal high-mass star. Note that the original source cited by the Wikipedia article just has the chart, with no additional information or links that I can find.
High-mass stars end their lives (at least some of the time) as core-collapse supernovae. Low-mass stars usually end their lives as white dwarfs. But sometimes white dwarfs that are in binary systems with another star get enough mass from the companion to become unstable and explode as so-called Type-Ia supernovae. Which “supernova” is being referred to in the Wikipedia graphic is not clear. The interpretation that makes the graphic the least wrong is the “supernova” here means “Type Ia Supernovae” or “exploding white dwarfs” as I call them. I will assume that “Large Stars” refers to the production in high-mass stars both during their lives and during the explosion that spews products of their nuclear fusion into the interstellar gas. It would also be possible to think that “Supernovae” refers to both massive star core-collapse supernovae and exploding white dwarfs. In this case, “Large Stars” could mean that massive stars make it before they explode and the supernovae is just the mechanism for kicking out. These categories are therefore 1) confusing and 2) incorrect no matter how you slice it.
Dying low-mass stars (aka “Small Stars”) make substantial amounts of the heavy elements, including most of the Pb in the solar system. There should be a lot of orange in the bottom half of the diagram. I don’t agree that Cr and Mn are made only in “Large Stars”, but Fe is made in both “Large Stars” and “Supernovae”. Basically all the iron in the Universe is made in explosive nucleosynthesis. The iron that massive stars make right before they explode as supernova is all destroyed/collapsed in the remnant. And so on.
The information for Li is incorrect. 6Li is indeed made by cosmic rays (fast-moving nuclei) hitting other nuclei and breaking them apart. But most of the far more common 7Li isotope is without question made in low-mass stars and spewed out out into the Universe as the star dies. Some 7Li is also made in the Big Bang and a small fraction by cosmic ray fission.
This post does not need to be any longer, but I would like to end by pointing out a difference between the Wikipedia graphic and my graphic caused by the fact that we still don’t know everything. A fraction of the heavy elements, including most of the Au, are formed in the “rapid neutron-capture process“. Where that happens is currently in dispute. It could be in massive star supernovae close to the forming neutron-star. More recently, there is compelling evidence that most of the r-process happens when two neutron stars spiral together and merge. That is why “merging neutron stars” is a category in my chart, but “Supernovae” takes the role in the Wikipedia chart.
Note
Backing this statement up with actual evidence may be the basis for a future blog post. Please let me know in comments if you are interested in a blog post on a particular subject.
www.astronomy.ohio-state.edu/~jaj/